Distrigo Pinpoint
|
Client |
Stellantis |
|
Website |
distrigoparts.co.uk |
|
Framework |
React with Mapbox GL JS integration |
|
Developed by |
April Six (www.aprilsix.com) |
Project Description
I enjoyed my time at April Six as a senior developer. I worked on a number of projects but my favourite was a mapping system called pinpoint that allowed the client, Stellantis (previously PSA Group), to have a geographic overview of where their customers were located.
Pinpoint is a tool for Distrigo's sales team to help them discover areas where the may be potential new customers and also identify the best locations where they can focus on existing clients.
The tool uses Mapbox GL JS to display the data on a map and a lot of the work was focused on improving the rendering performance of the system as well as cleaning up the user inferface.
Key Features
Pinpoint design changes
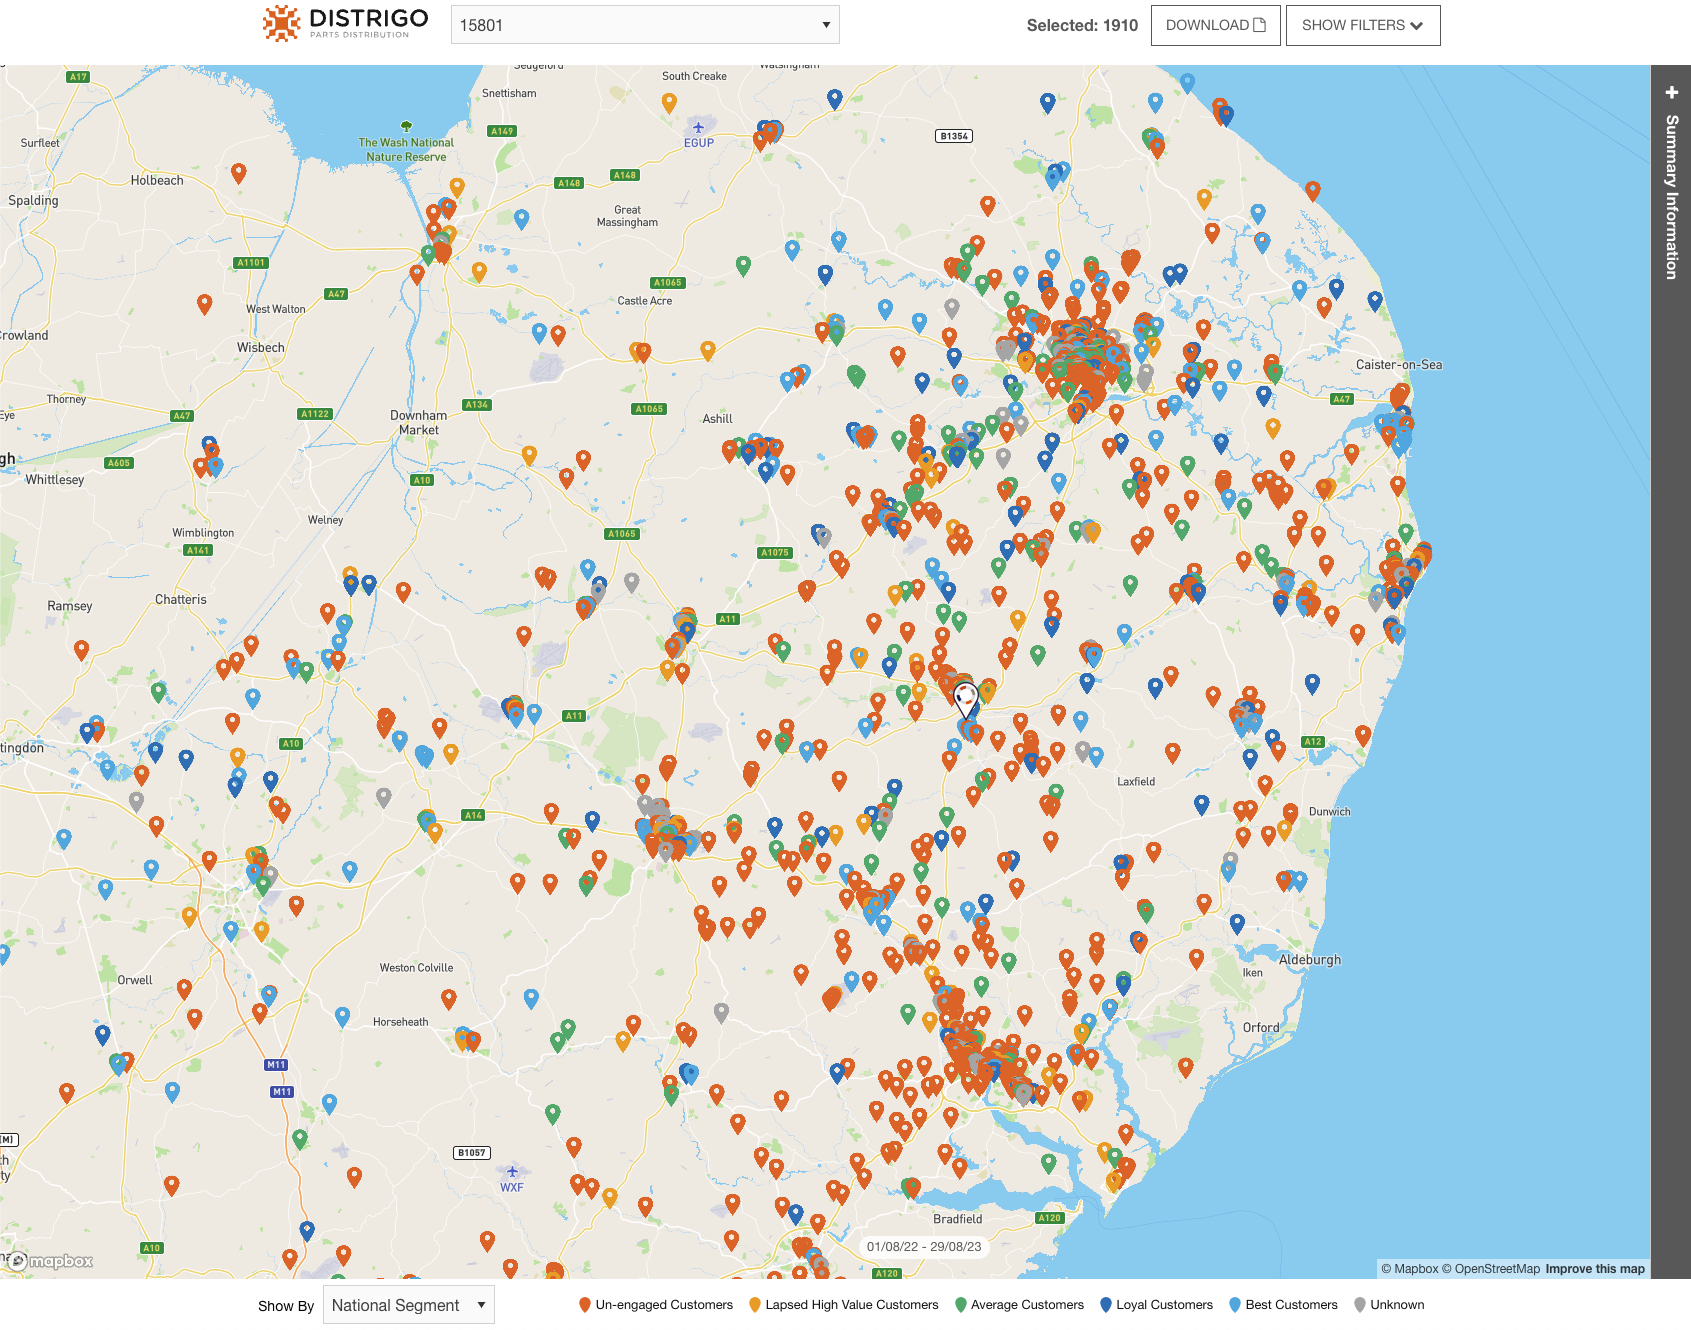
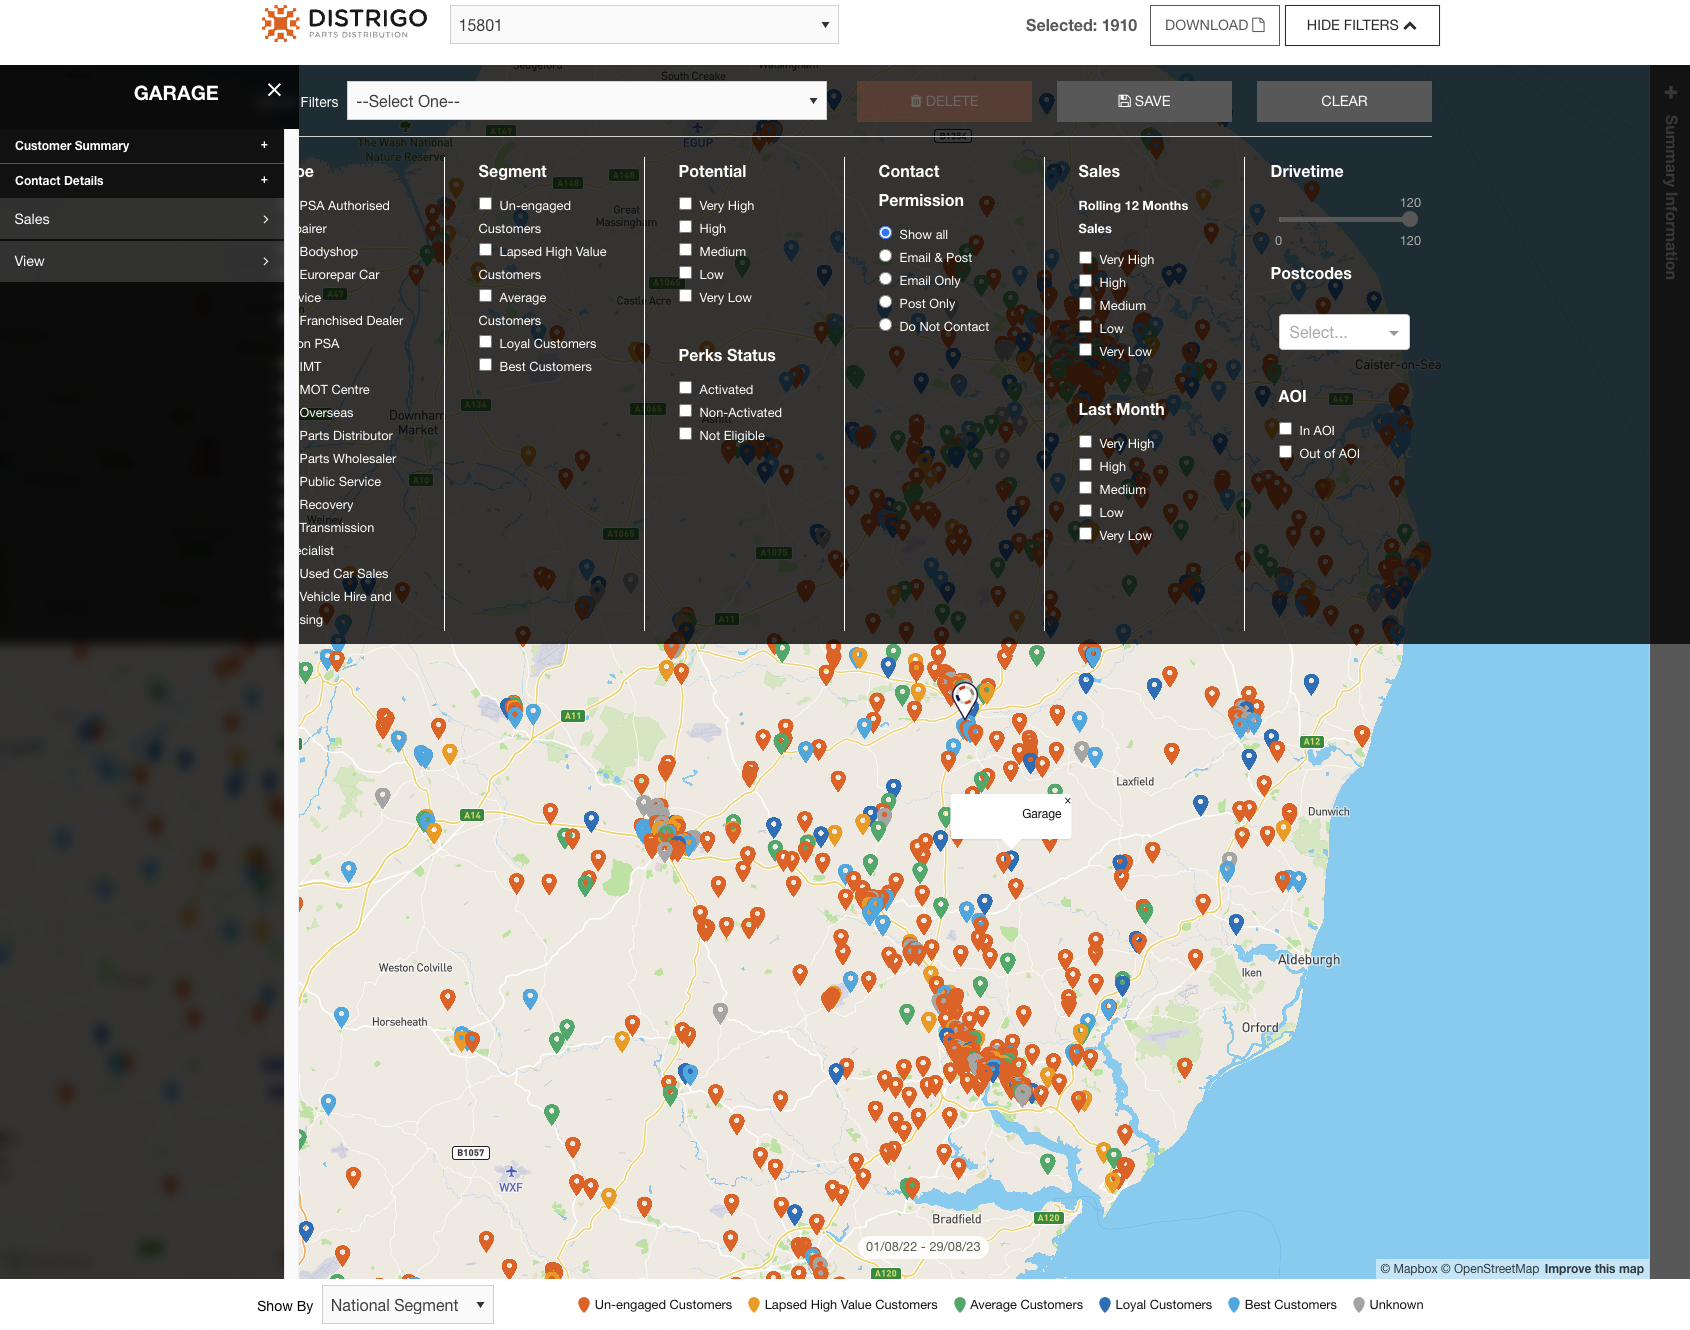
This is a screenshot of the website before. Here you can see the map is very cluttered and the user has to close the filter menu to see the information they need to see. The information panel overlaps the filter panel making each one difficult to use. The information panel also takes up a lot of empty space. With the panels open the map becomes less usable.
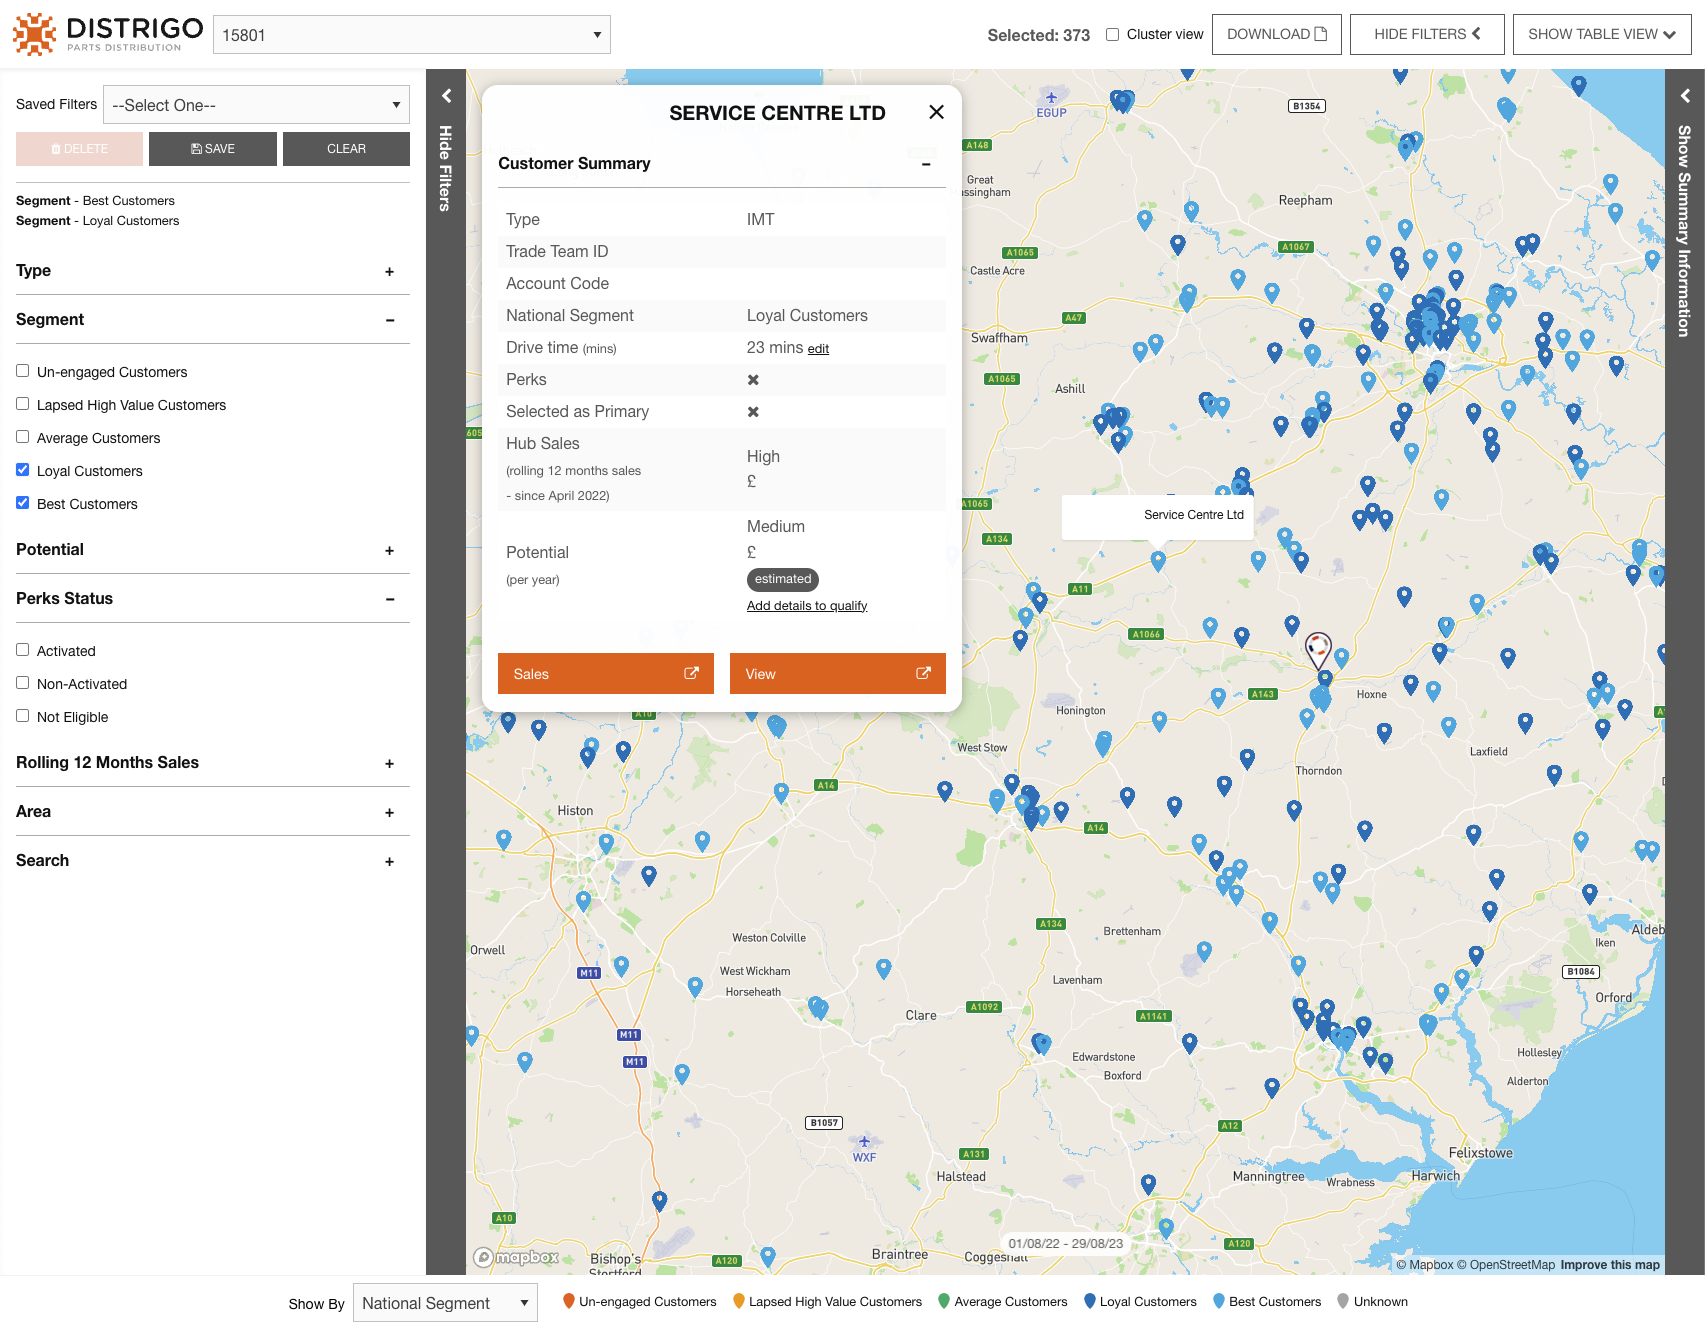
Here is the result of all the changes. The map is now a lot more user friendly and the user can now see the information they need to see without having to close the filer menu. The information panel only uses up the space it needs and the buttons at the bottom are much more apparent.
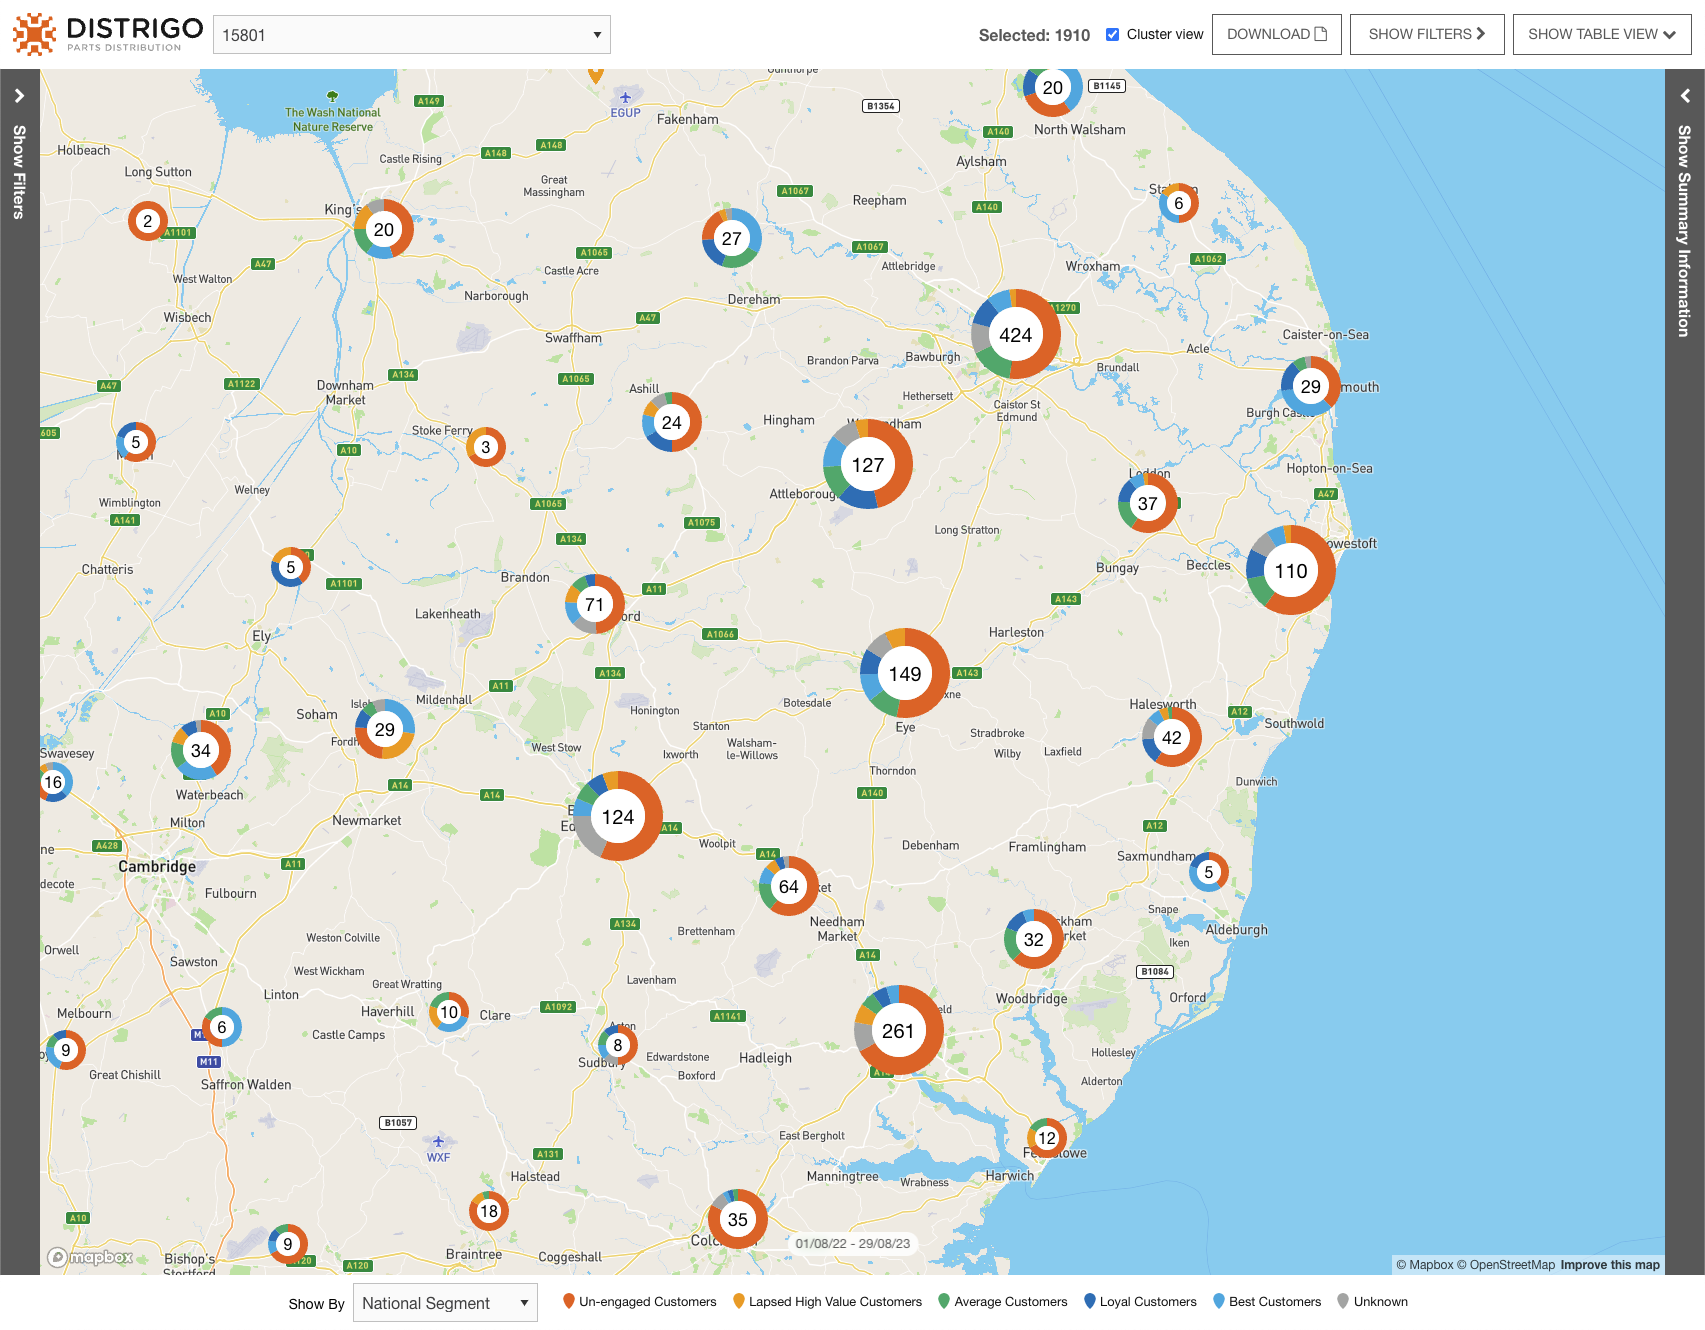
Clustered data
The map now clusters the data so that the user can see the data in a more manageable way. The user can also zoom in and see the data in more detail. Whilst the pins are useful for seeing an overview of where Distrigo's customers are the cluster view gives a clear snap shot of the best areas to focus in on.
Like what you see? Let's talk!